Learning
Center
|

 |
Model
Portfolio
|


 |
|
|
3rd Quarter,
2002
September 30, 2002
During most of July the market
averages continued their downward path reaching new lows and then rallying
furiously for almost a month. That rally pumped our portfolio more than
12% but our new stop system, which was designed to keep us longer in the
markets, managed to give back all the profits. What happened was that the
turnaround was so quick that, our new trailing stops were hit before the
trend indicators signaled the end of the move. However, after a brief
study, it was determined that even if we had kept the old stop system in
place, the end result would had been more or less the same. The old system
would have taken us out quickly, thereby keeping more profits. However, the trend indicator, still signaling
an uptrend, would have taken us in again, just in time to get caught in the
new downtrend. It was not until mid September that our trend indicator
changed direction from up to down. As a side note, it is interesting to
note that most of the profit loss actually came from our Russell 2000
position, whose entry signal was given 7 trading days after the rest of
the indexes we trade. As a matter of fact, Our position in the Dow Jones
broke even and the S&P500, S&P400 and Nasdaq-100 were close at
profits of 2.12% (0.39R), 2.51% (0.52R) and 1.40% (0.20R) respectively.
The loss on the Russell 2000 was 3.23% (0.51R). Still we managed to hold ground overall, greatly
outperforming the S&P500. Considering that the failed rally didn't
raise the indexes high enough, we decided NOT to open short positions.
This date also marks the first
anniversary of the portfolio. While our reliability of 63.33% is close to
that of our historical study, our expectancy of -0.03 is way out of
target. A review of the trades made through the period showed us that the
main problem resides in low R multiples for the winning trades. To this
date all losing trades, except one, have -1R or less. The only exception
was a -1.47R trade, made during the 4th quarter of 2001 and that was the
direct result of a discipline failure. One more reason to implement the
new stop management system. The adjustments made to our stop system will help us
to boost the size of our gains relative to our initial risk. Also, we
recognize that the decision to use stop orders had a direct impact on the
expectancy by adding to our transaction costs on an account with low
equity. However we are willing to delay the target date for achieving our
estimated expectancy, because the implementation of stop orders had
greatly improved the trading discipline. The
table below shows the performance of our portfolio net of management fees
and before taxes,
compared to the major U.S. indexes that we traded.
|
From Sep. 30, 2001 to Sep. 30, 2002 |
| GCM Model Portfolio |
-3.41% |
| Dow Jones 30 |
-14.19% |
| S&P 500 |
-21.68% |
| Nasdaq-100 |
-28.75% |
| S&P 400* |
-6.19% |
| Russell 2000 |
-10.52% |
| * For this index figure we used the ETF
MDY as a proxy |
Considering that we used our system almost entirely on the long side (28
out of 30 trades), the result of
the first 12 months are within reason.
Portfolio
Statistics
|
Final
Allocation
|
|
|
Performance
Period
to Date
|
Performance |
GCM
Portfolio |
S&P
500 |
|
| Quarter (1) |
-1.07% |
-15.83% |
| Quarter (2) |
-1.57% |
-15.83% |
| Year (1) |
-7.15% |
-28.99% |
| Year (2) |
-8.63% |
-28.99% |
|
(1)
Before management fees
(2)
Net after fees |
|
| Charts and data processed with
Captools Software and proprietary spreadsheets. Performance
net after management fees. Certain fixed expenses and taxes
excluded. |
|
|
Performance
Charts
|
|
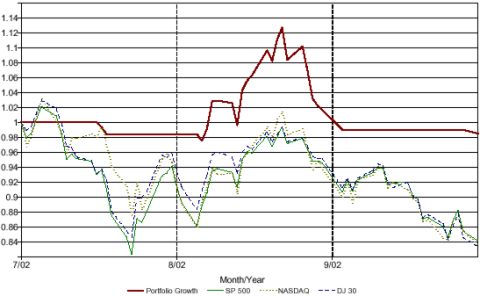
|
Quarter to Date
|
|
|
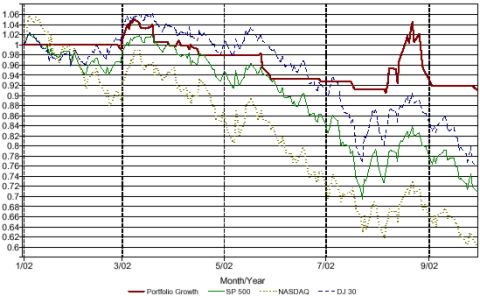
Year to Date
|
|
|